Google Cloud Traffic Visualization
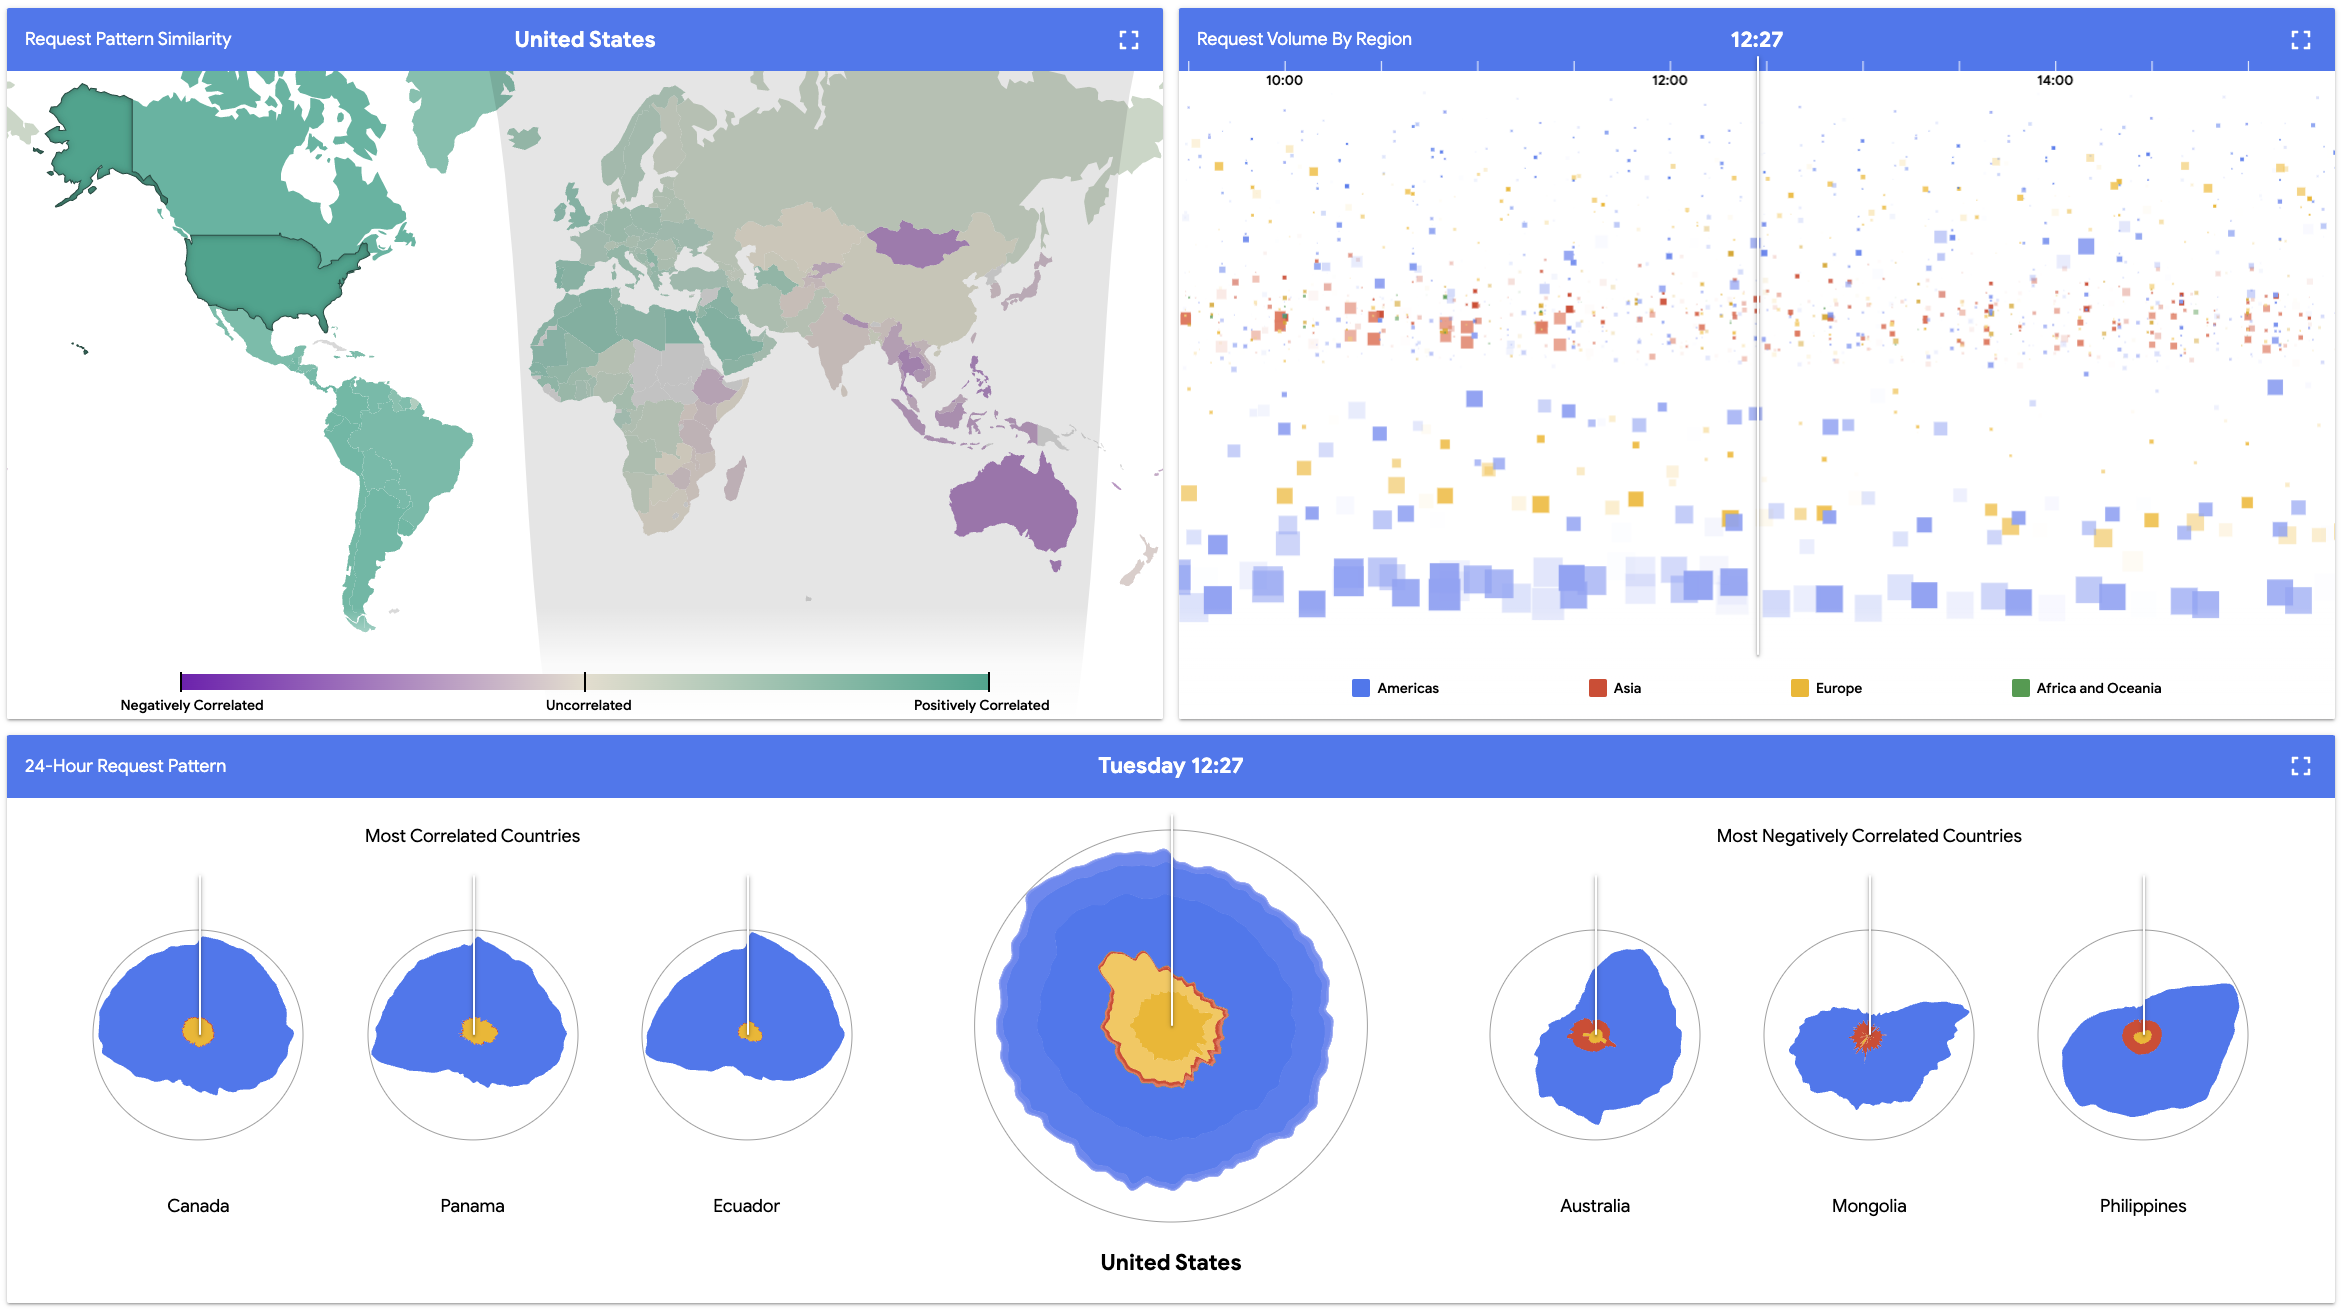
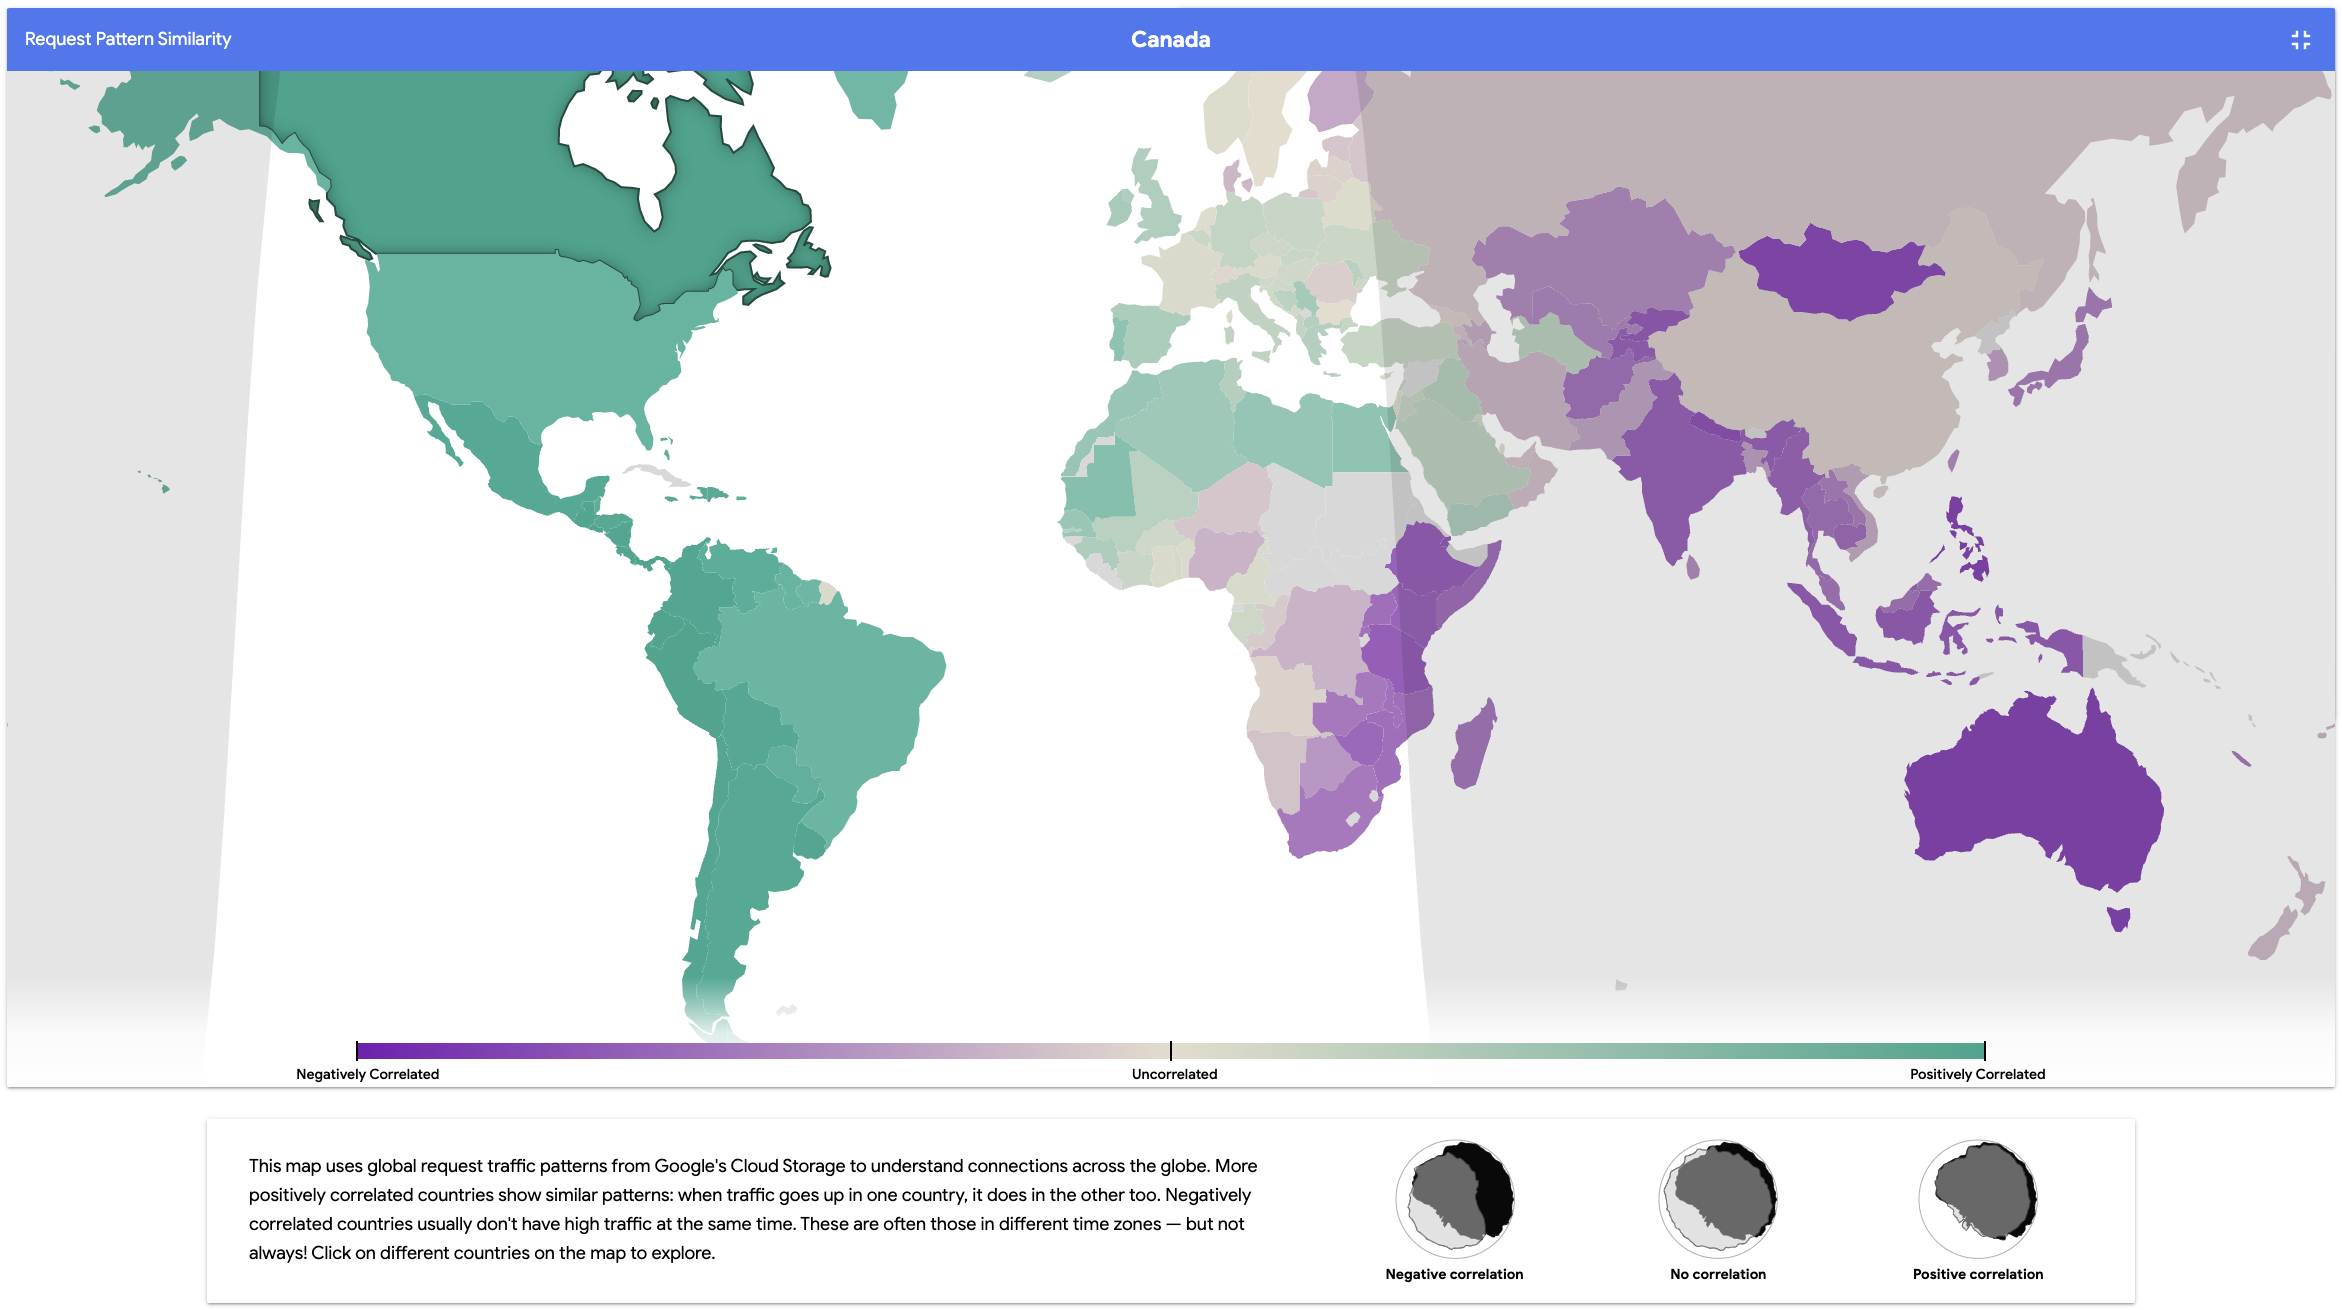
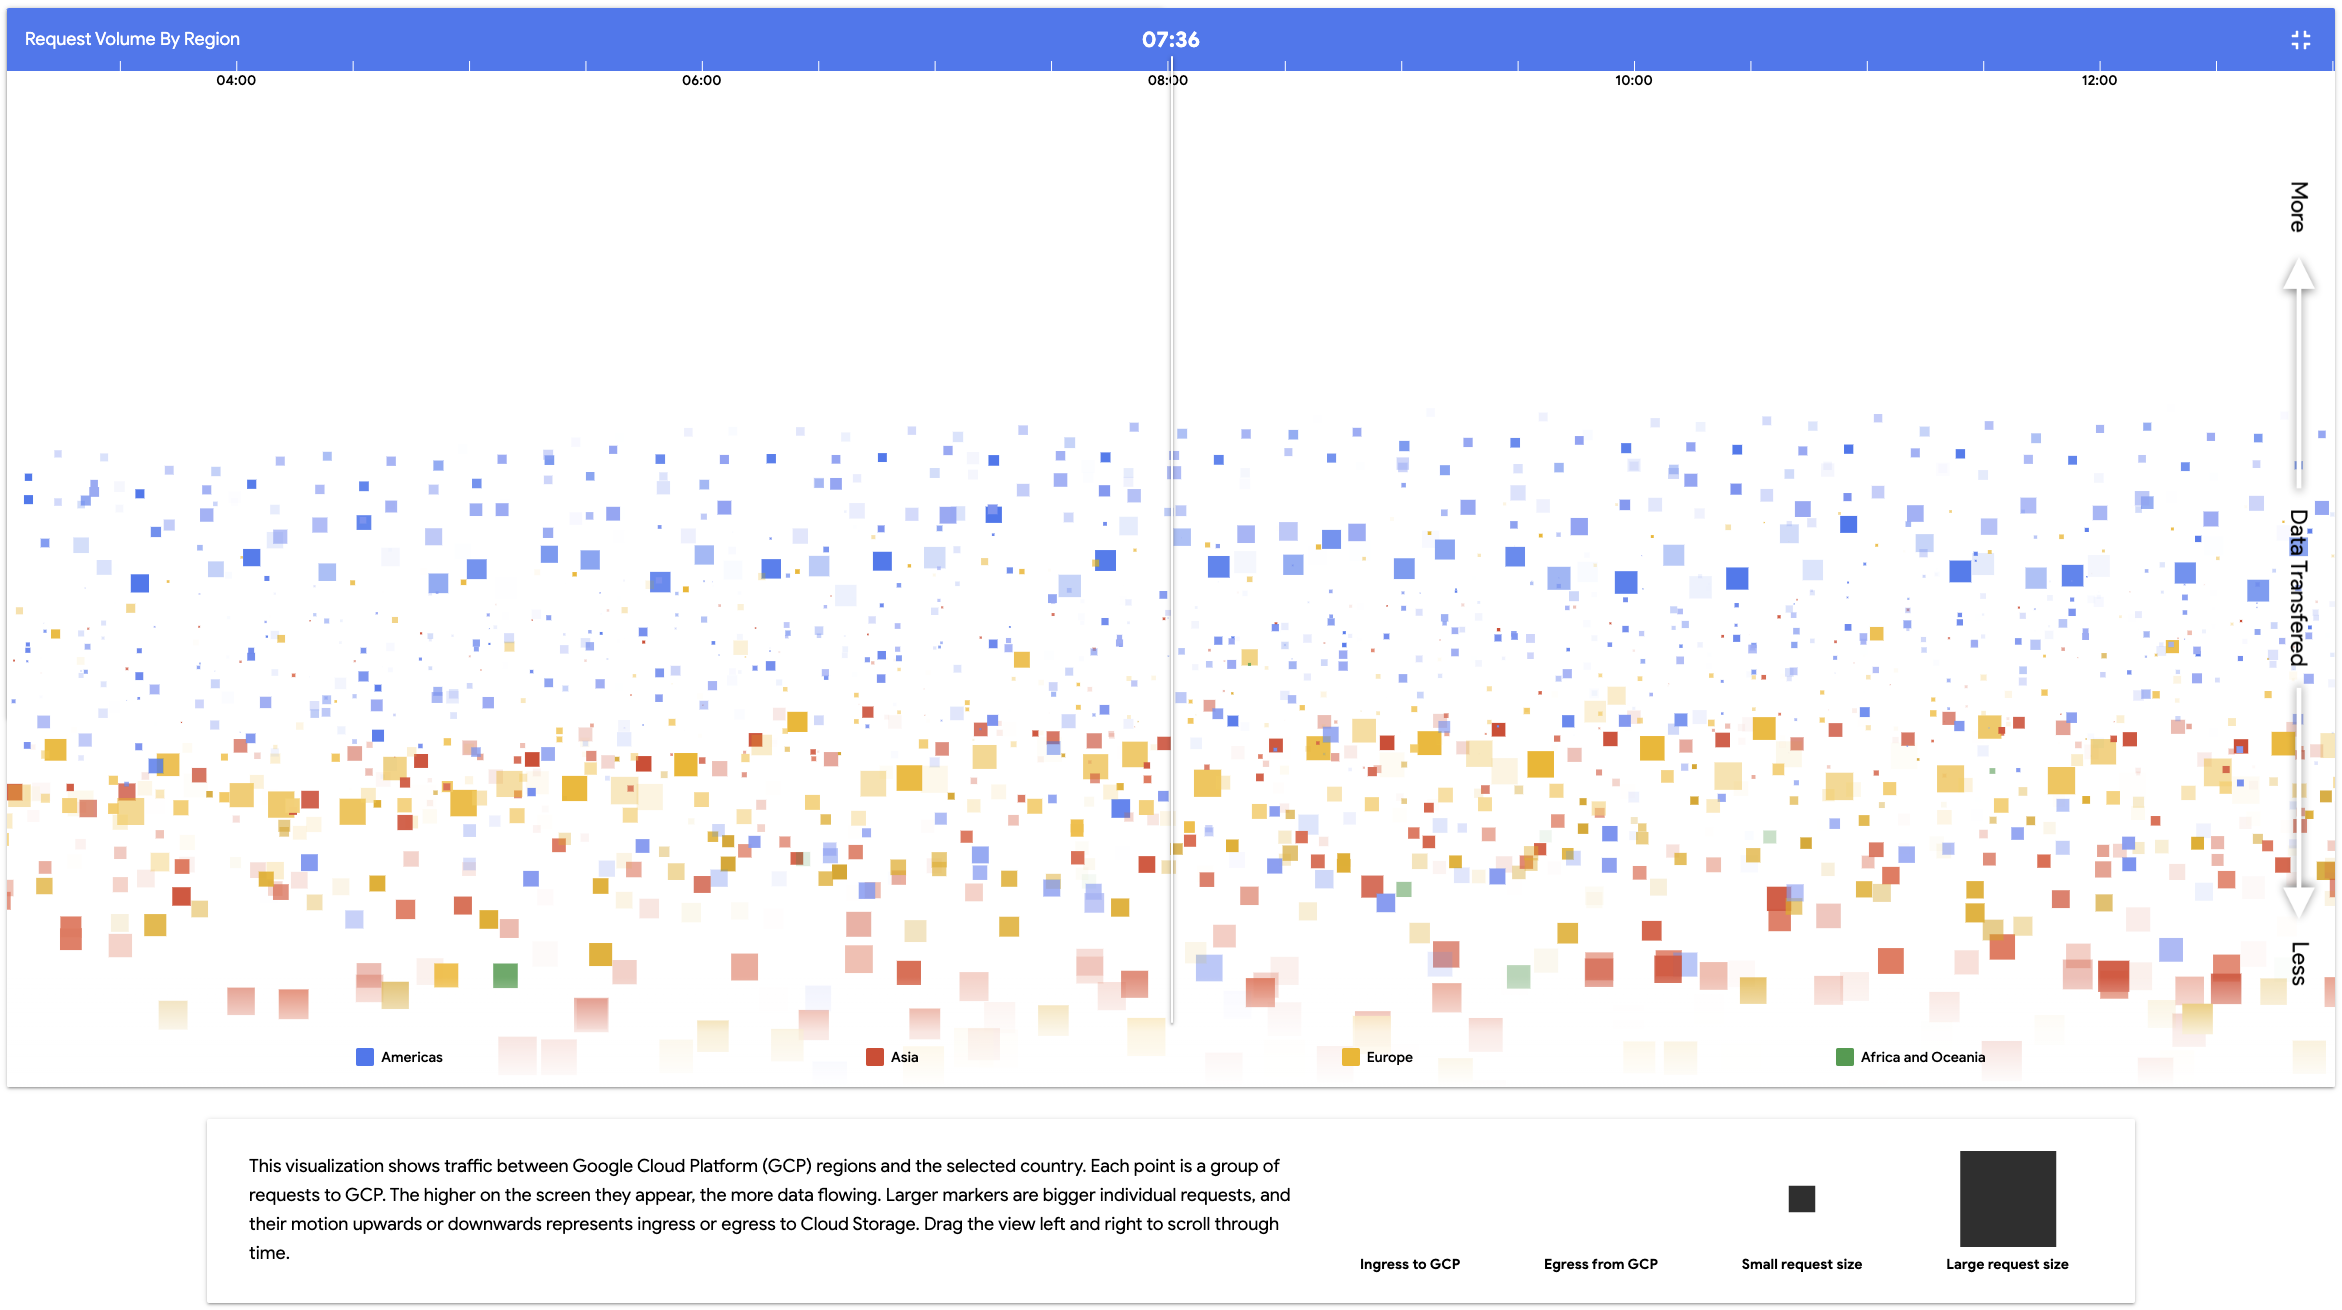
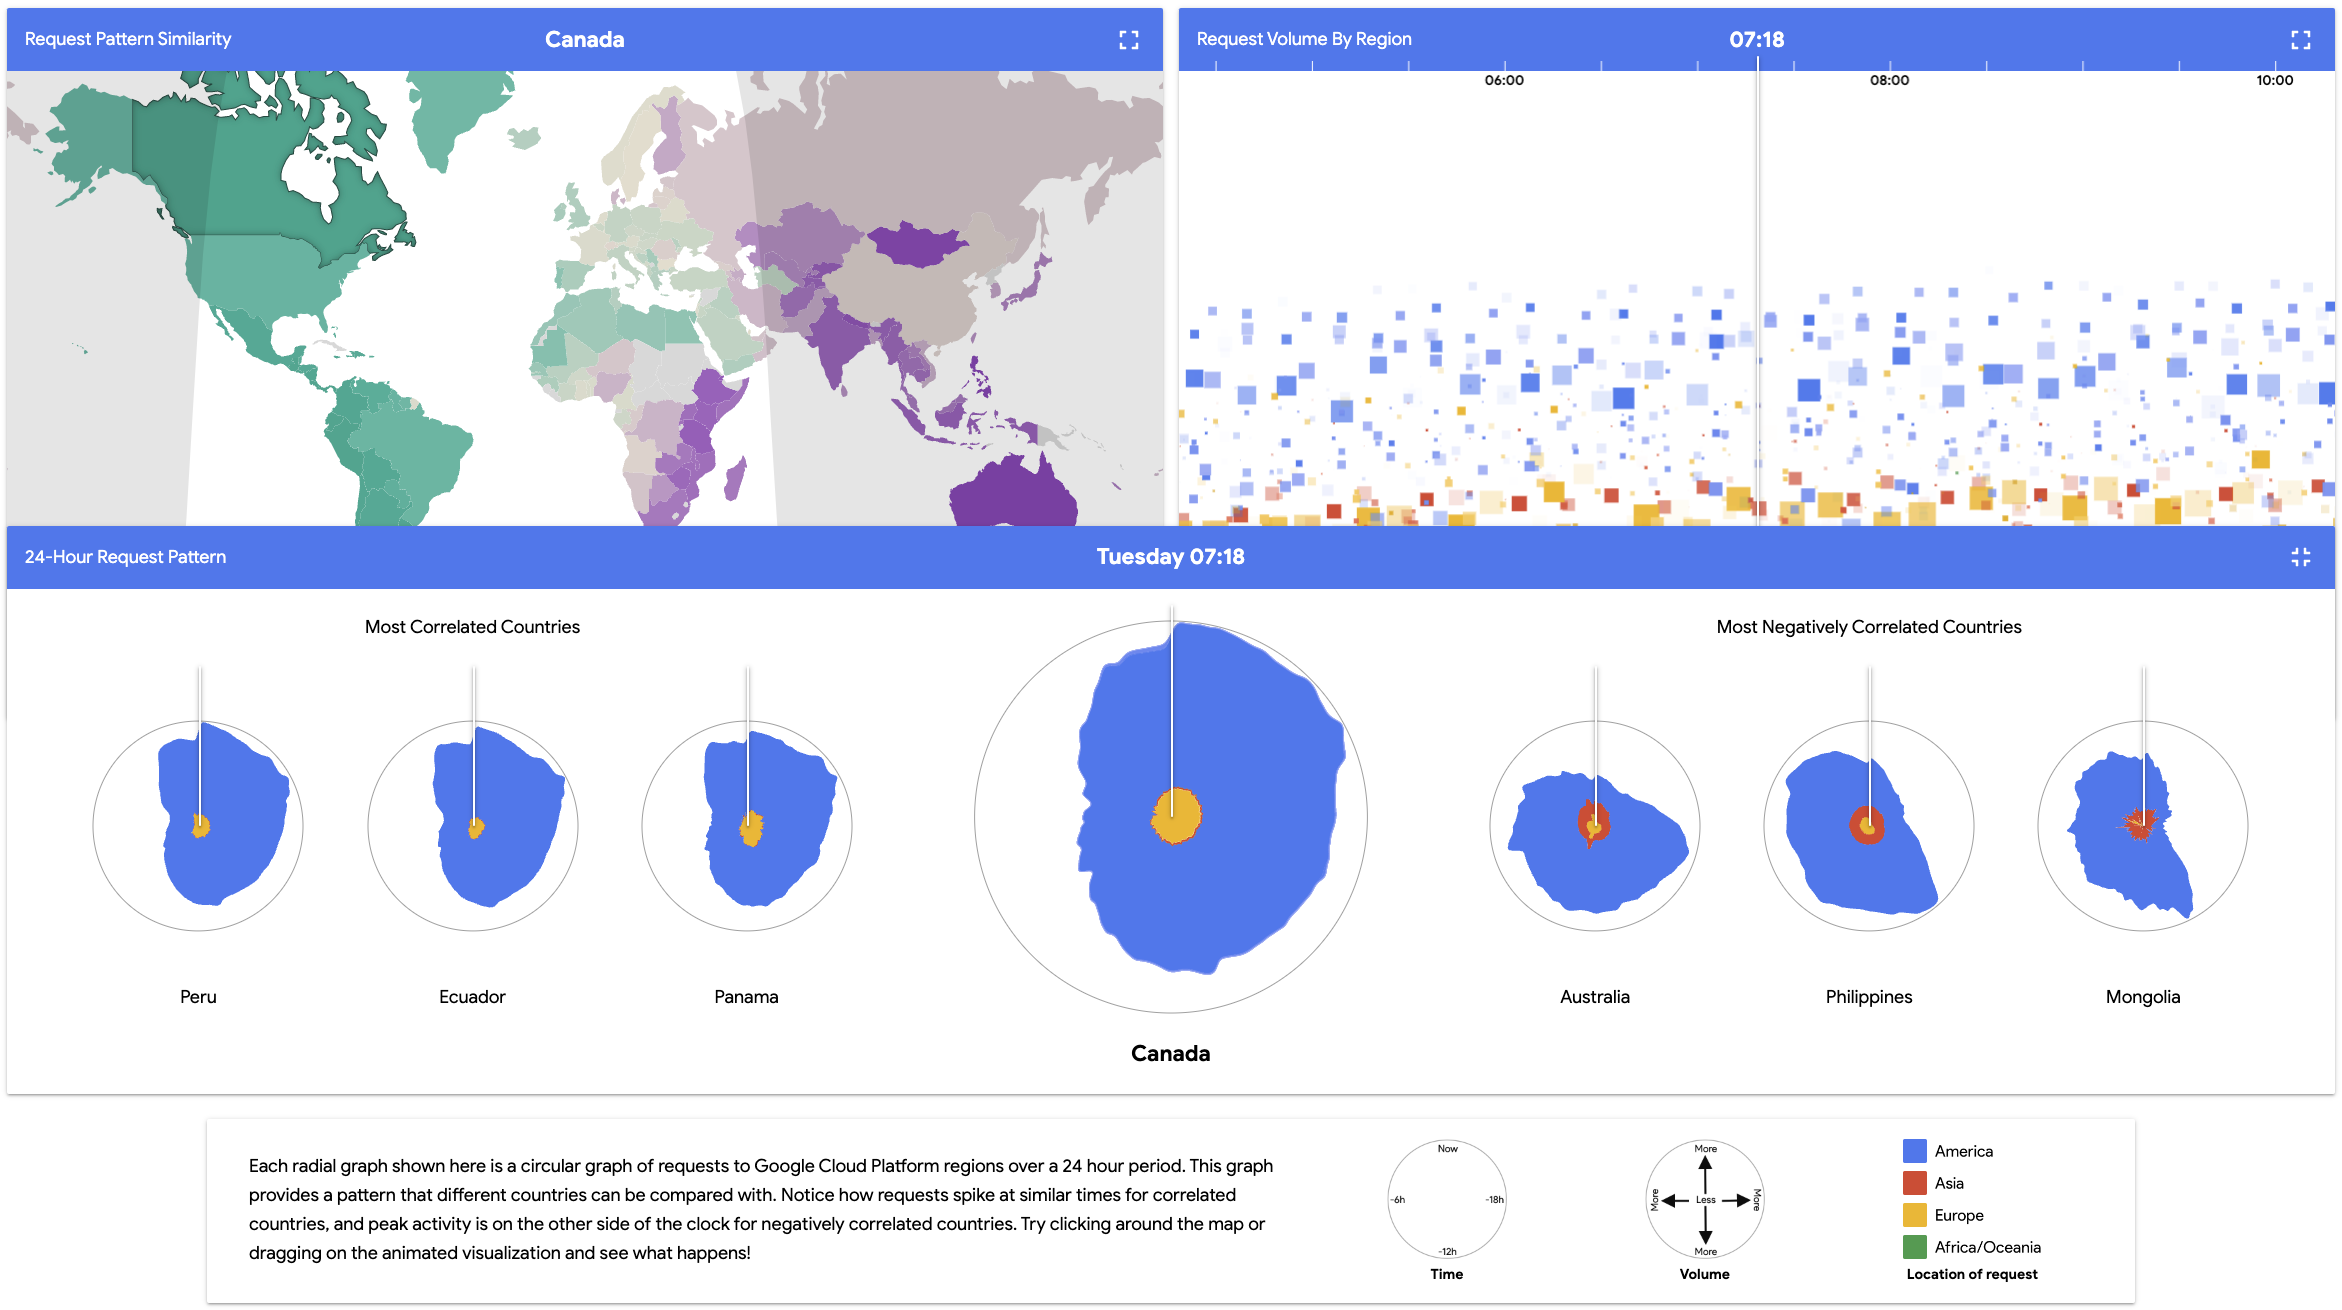
While at Stamen Design, Google's Cloud Platform team reached out to us for help visualizing global traffic patterns. The GCP team was interested in seeing the trajectory, velocity, and density of data moving around the globe. They wondered what a world map of those requests would look like. We explored a weeks worth of planetary-level data of their service to attempt to uncover interestinng patterns and trends.
This data visualization was installed at Google Cloud Next in San Francisco and Tokyo. You can read more indepth about the process in this blog post.