Health Atlas with UCSF Department of Epidemiology
The Health Atlas was designed with health researchers, policy makers, and community advocates in mind to allow exploration of over a hundred social determinants of health and health metrics across California at the census tract and county levels. On top of this interface is a series of data stories that help bring this work to life, illuminating issues like food and housing insecurity across the state, neighborhood by neighborhood.
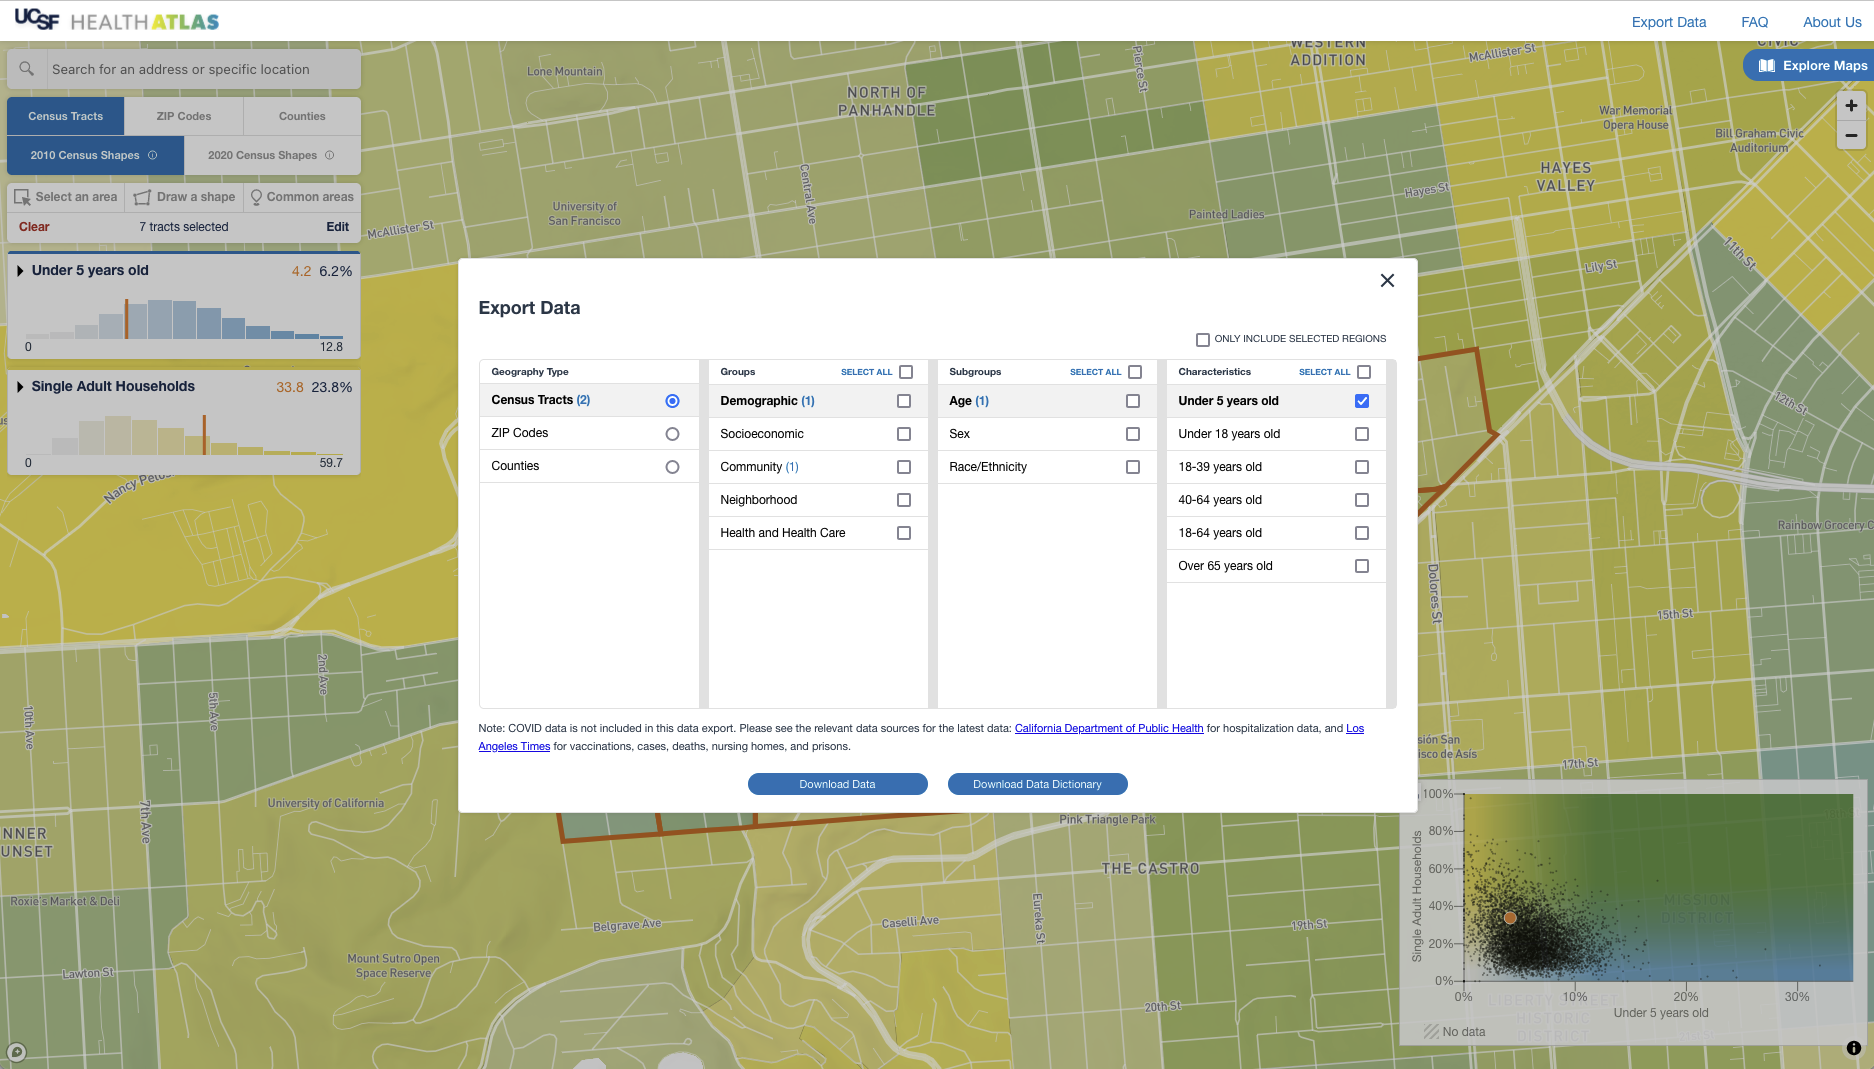
You can visit the Health Atlas site here.
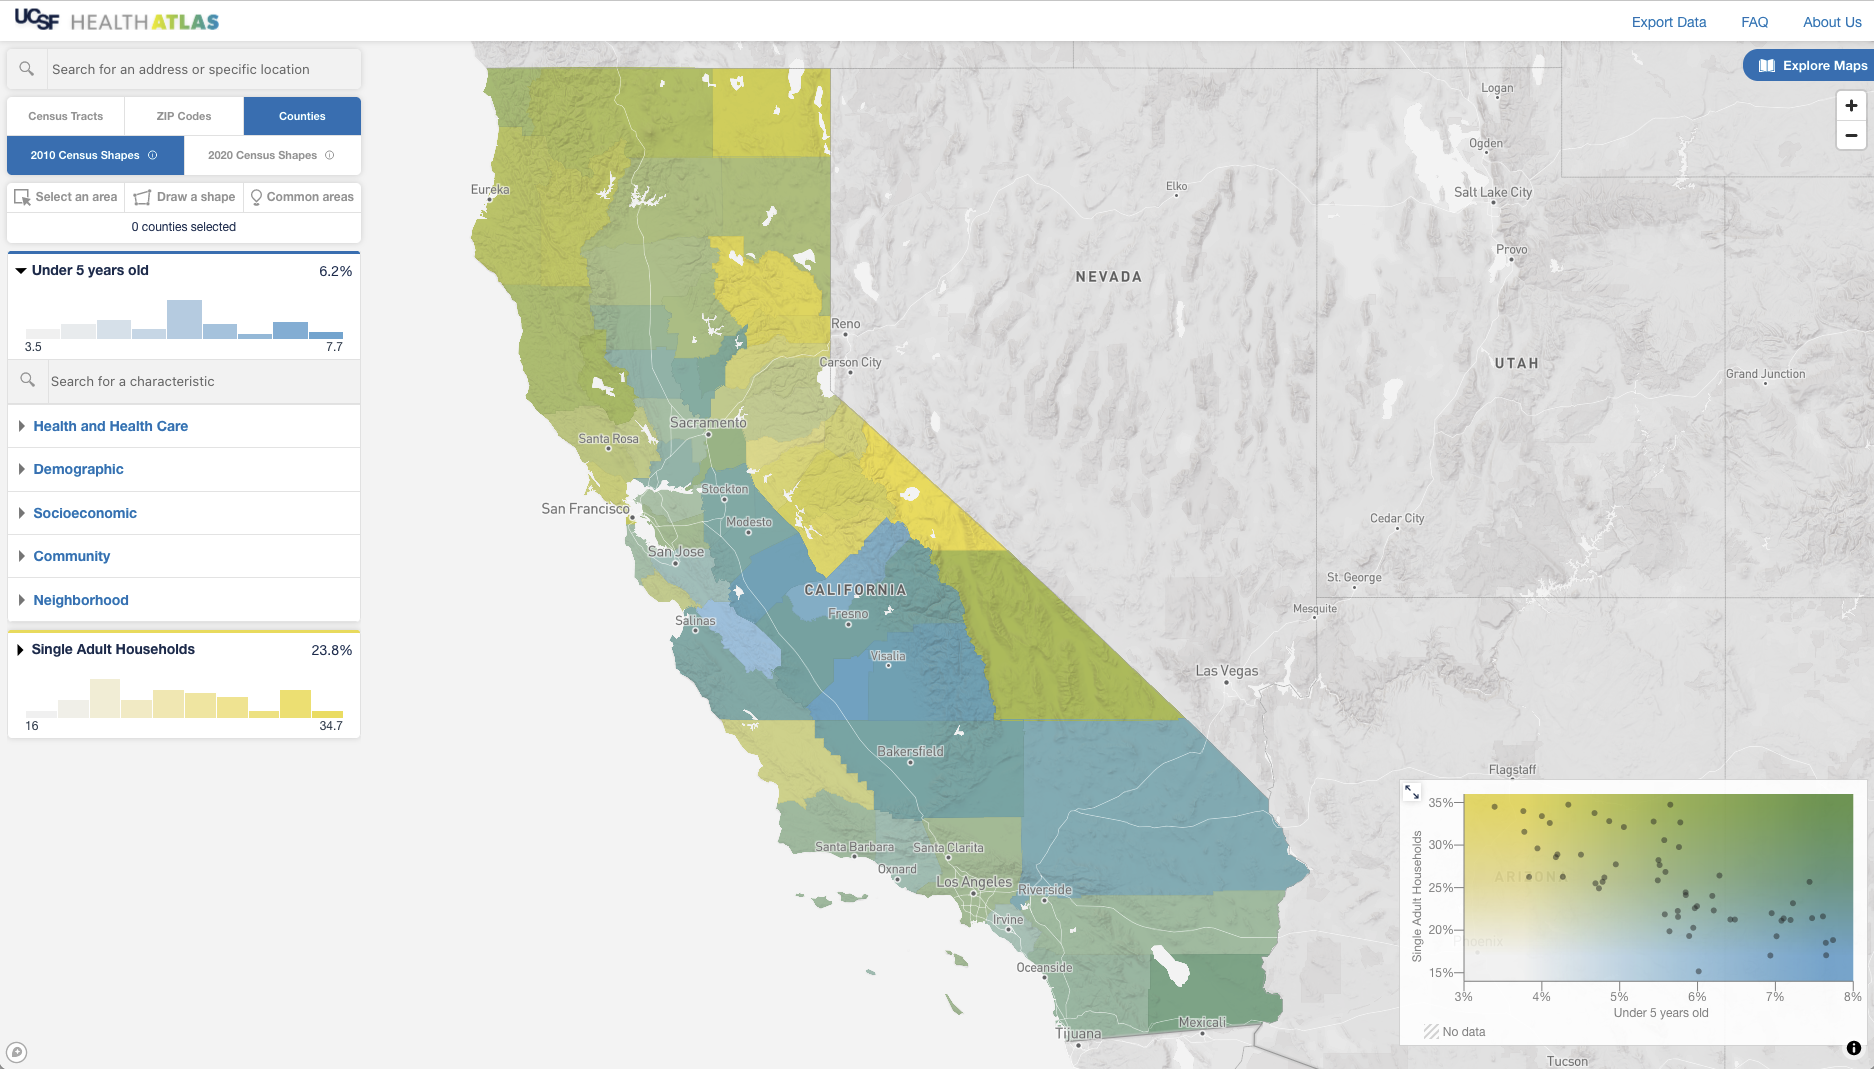
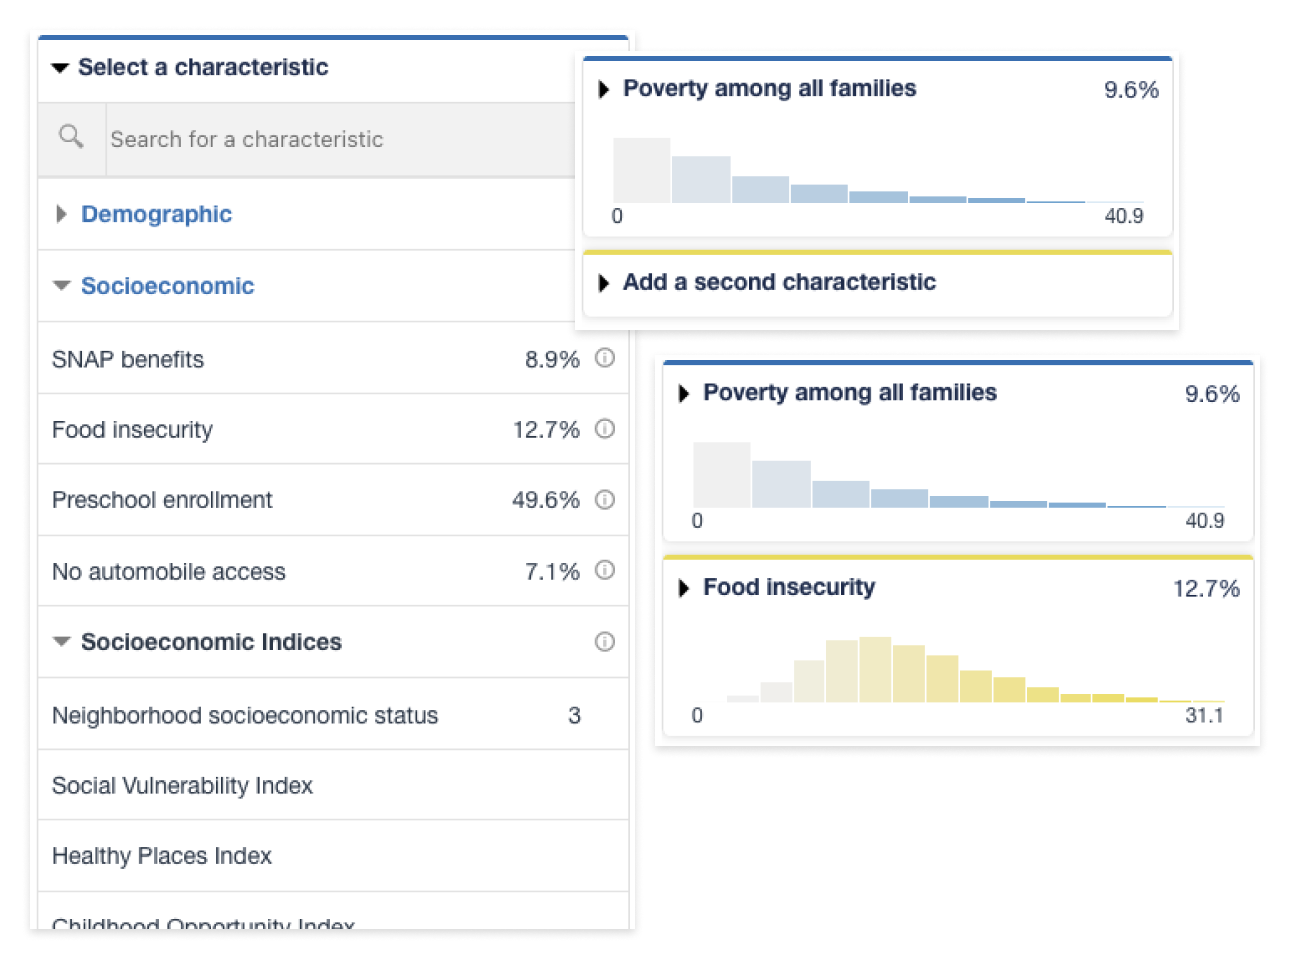
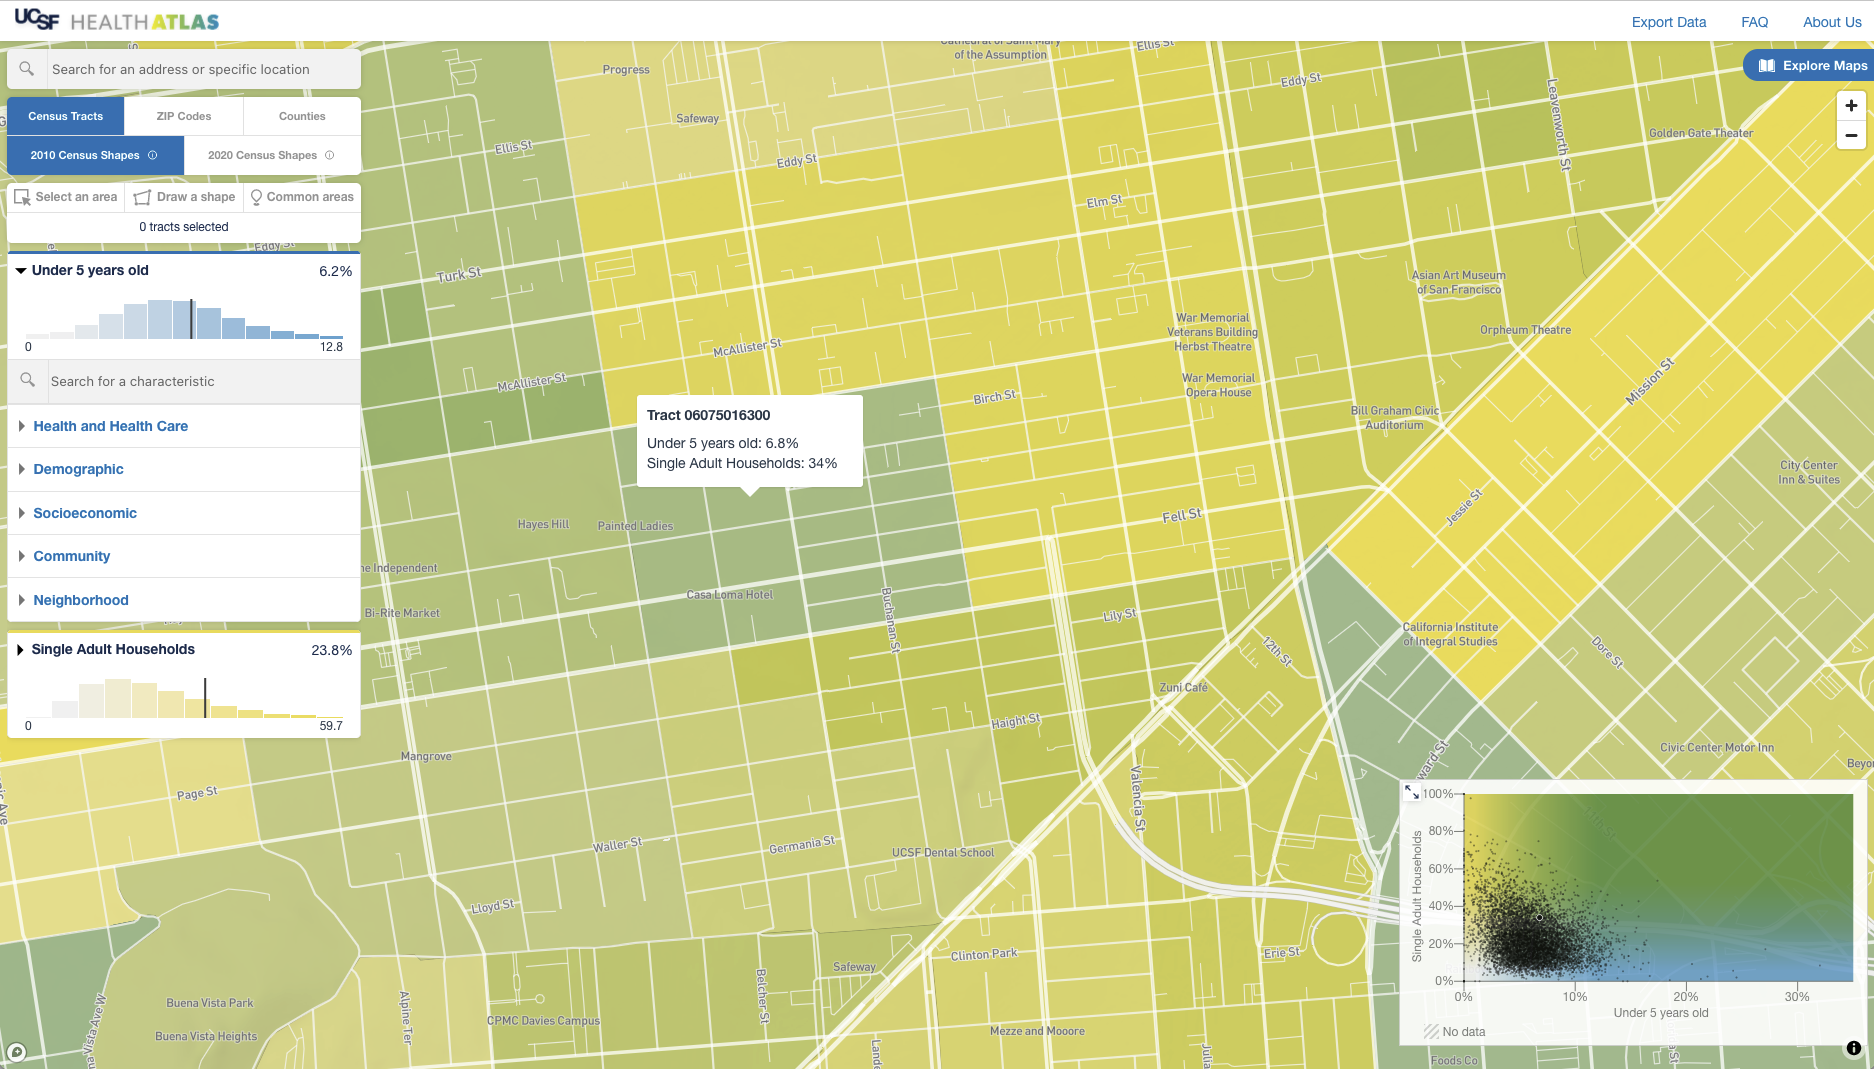
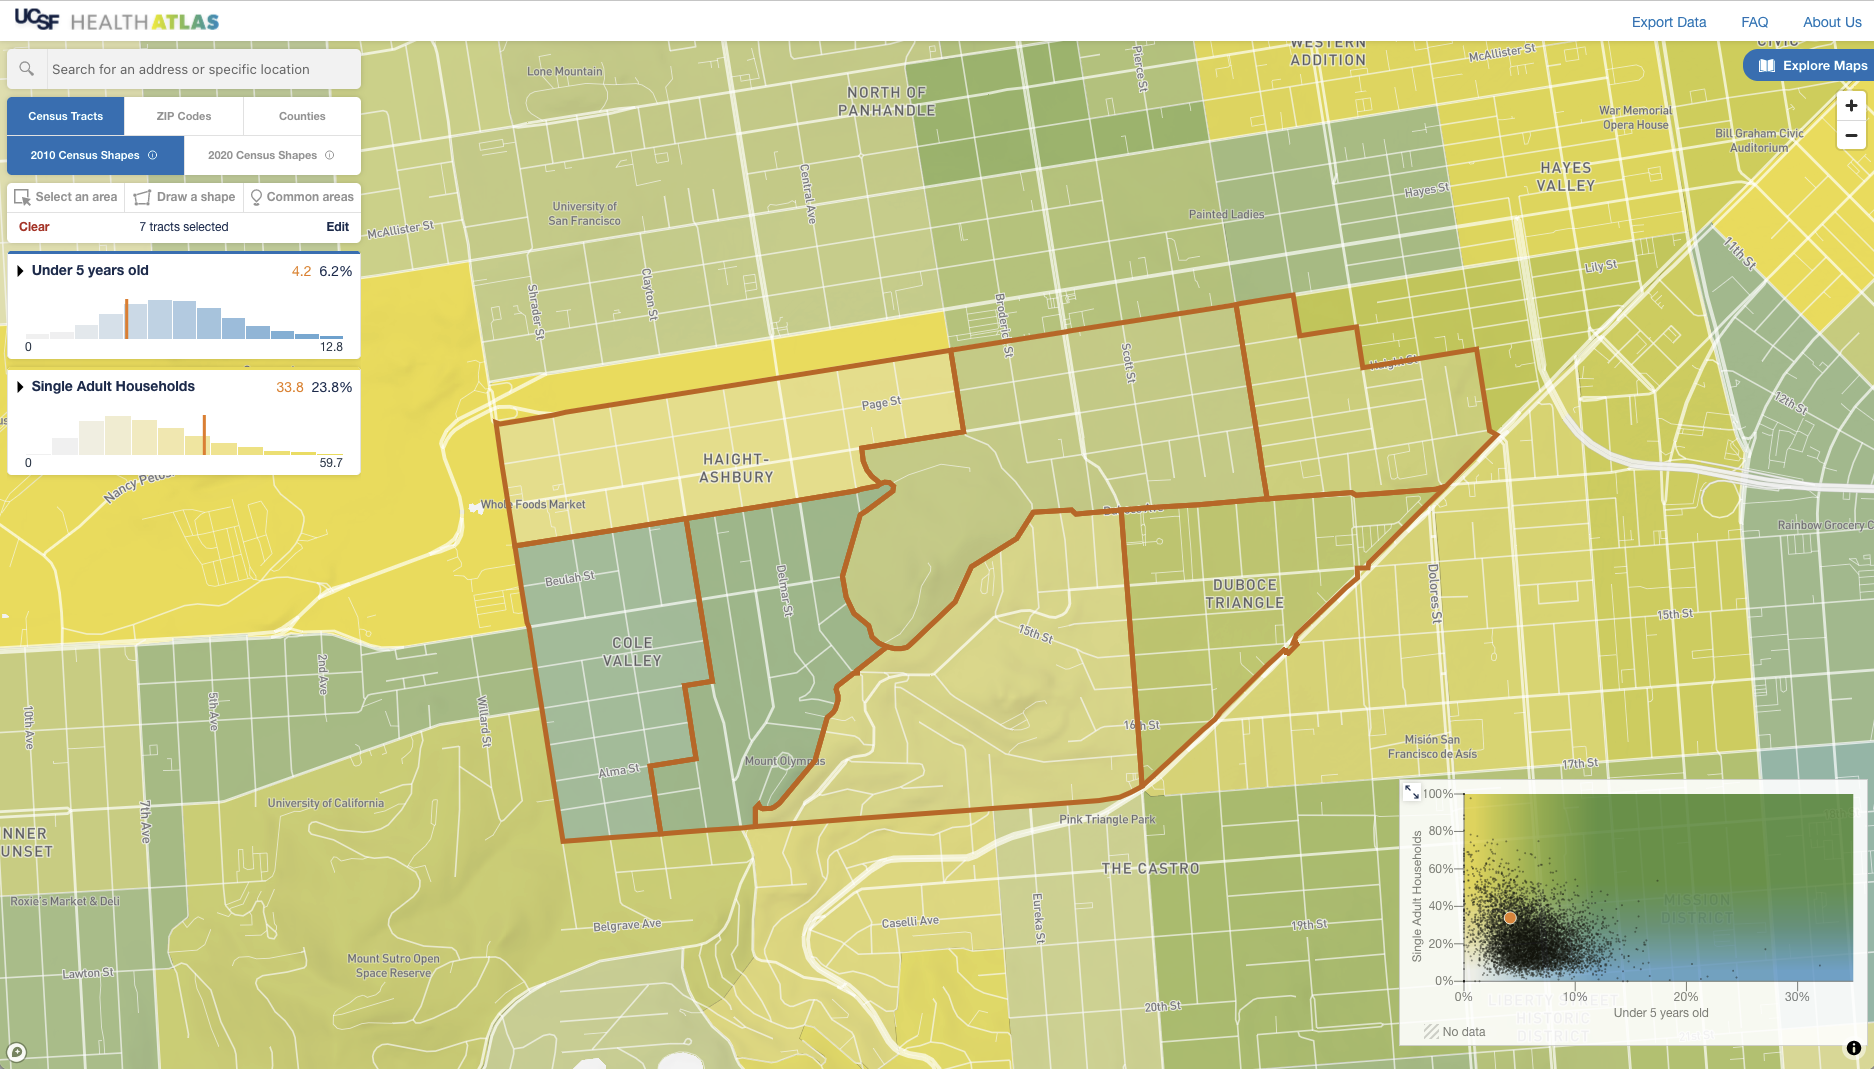
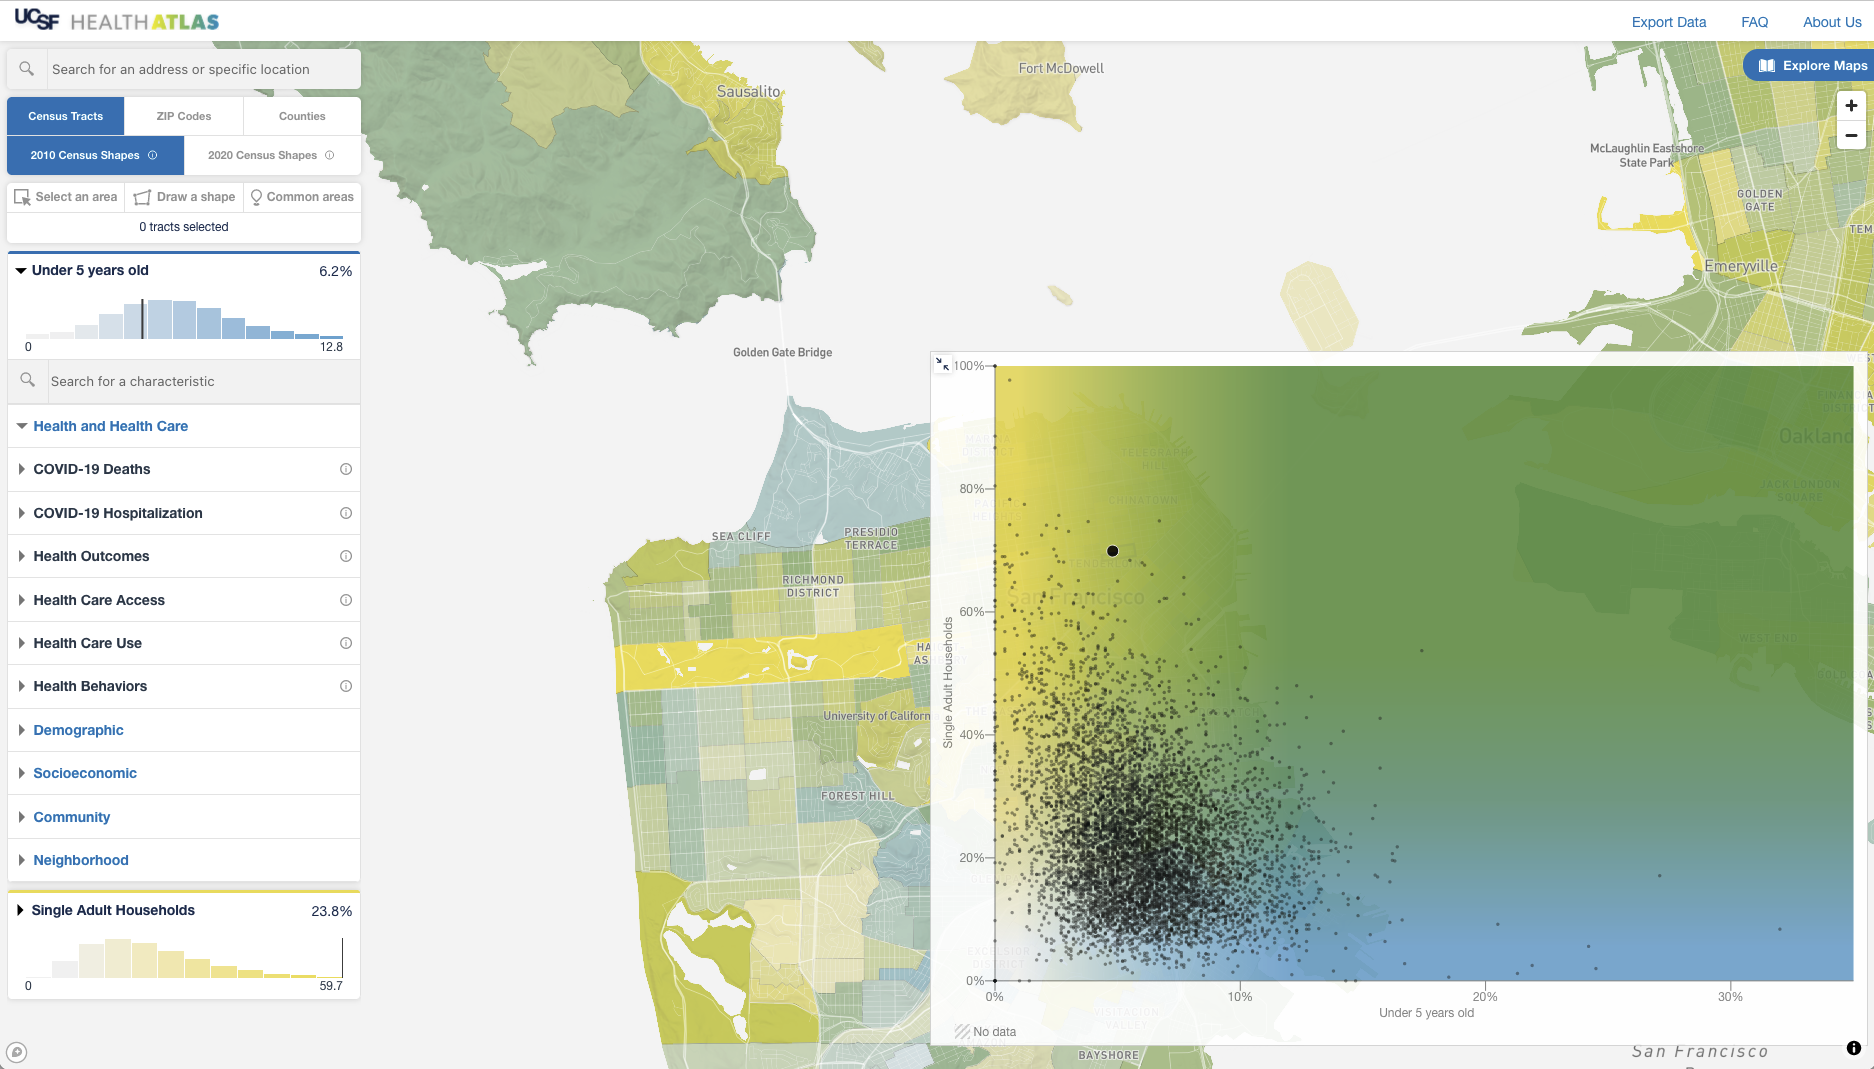
Select from dozens of characteristics. Characteristics are grouped into Demographic, Socioeconomic, Community, Neighborhood, and Health and Health Care.
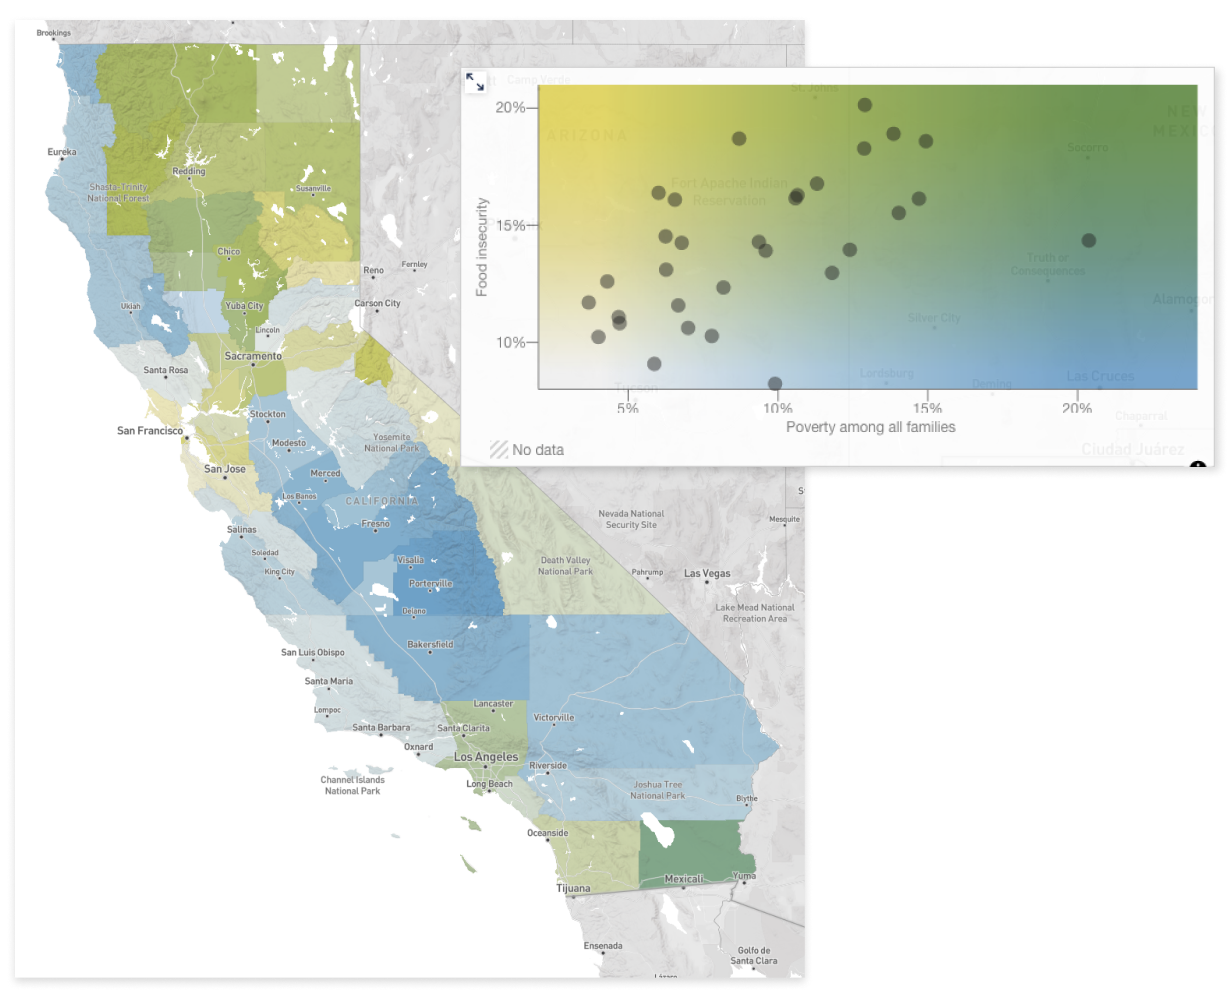
After selecting a characteristic, a histogram showing the distribution of California counties is displayed. You can add a second characteristic that when then create a bivariate choropleth map and a scatter plot.
Underneath: Bivariate choropleth map showing the two selected characteristics on a map of California Counties.
On top: A scatter plot of the same two selected characteristics acts as a color legend with circles showing the distribution of each County.